
相关网站
https://echarts.apache.org/examples/zh/index.html#chart-type-line
https://echarts.apache.org/zh/option.html#title
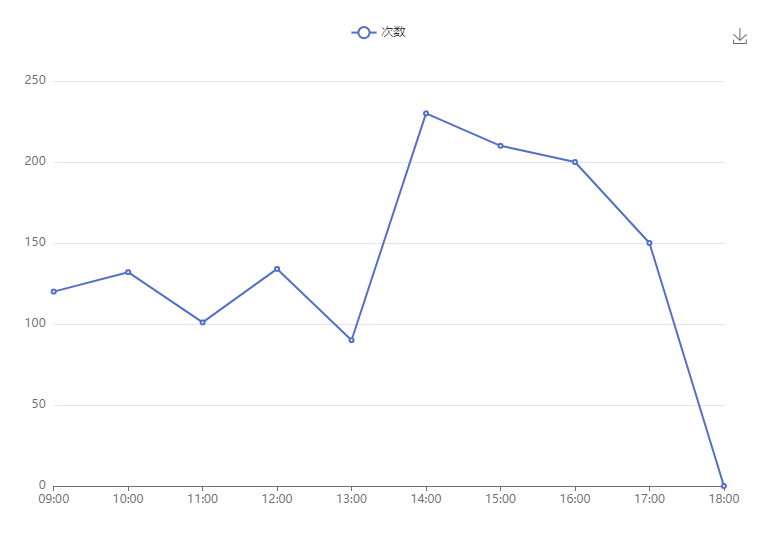
渲染成功效果图
开始
安装
pnpm add echarts vue-echarts
配置,在 nuxt-config.ts 文件中
export default defineNuxtConfig({
  typescript: {
    strict: true,
  },
  build: {
    transpile:[/echarts/]
  },
  ……
});
新建 plugins 目录,在目录下新建 echart.ts 文件
plugins 目录下的文件会自动发现,不需要在 nuxt-config.ts 文件中手动配置
// 在这里,如果引入了模块,在使用的地方,就可以不用引入。比如在这里引入了 GridComponent,在使用的地方就不需要再引入

import { use } from 'echarts/core';
import { CanvasRenderer } from 'echarts/renderers';
import { BarChart } from 'echarts/charts';
import { GridComponent, TooltipComponent, ToolboxComponent } from 'echarts/components';

export default defineNuxtPlugin(() => {
    use([CanvasRenderer, BarChart, GridComponent, TooltipComponent, ToolboxComponent]);
});
使用
假如,有一个能正常访问的页面,对应路由是 /chart_line,对应的文件是 chart_line.vue。现在来丰富内容,渲染一个图表出来。
在 plugins/chart 中已经引入了 CanvasRenderer 和 ToolboxComponent,所以在这里不需要他们,可以注释掉。
<template>
    <NuxtLayout name="base">
        <client-only>
            <v-chart class="chart mt-5" :option="option" />
        </client-only>
    </NuxtLayout>
</template>

<script setup lang="ts">
import VChart, { THEME_KEY } from 'vue-echarts';
import { use } from 'echarts/core';
import { CanvasRenderer } from 'echarts/renderers';
import { LineChart } from 'echarts/charts';
import {
    LegendComponent,
    ToolboxComponent,
} from 'echarts/components';

use([
    // CanvasRenderer,
    // ToolboxComponent,
    LineChart,
    LegendComponent,
]);

const os = {
    tooltip: {
        trigger: 'axis'
    },
    legend: {
        data: ['次数']
    },
    grid: {
        left: '3%',
        right: '4%',
        bottom: '3%',
        containLabel: true
    },
    toolbox: {
        feature: {
            saveAsImage: {}
        }
    },
    xAxis: {
        type: 'category',
        boundaryGap: false,
        data: ['09:00', '10:00', '11:00', '12:00', '13:00', '14:00', '15:00', '16:00', '17:00', '18:00']
    },
    yAxis: {
        type: 'value'
    },
    series: [
        {
            name: '次数',
            type: 'line',
            stack: 'Total',
            data: [120, 132, 101, 134, 90, 230, 210, 200, 150, 0]
        }
    ]
}
const option = ref(os);
</script>

<style lang="scss" scoped>
.chart {
    height: 500px;
}
</style>
这样就可以了。使用更多图表,可以去官网查看对应的。如果使用中,缺少组件报错,引入进来就可以。
echarts 一些常规需求配置
- 纵坐标不想出现小数可以这样配置。
  yAxis: {
    type: "value",
    minInterval: 1,
    axisLabel: {
      formatter: "{value}",
    },
},- 多条折线,参考轴都是同一个可以这样配置
# 注释掉 stack
 {
    name: '次数',
    type: 'line',
    // stack: 'Total',
    …
 }
如果想要多个 y 轴,可以配置 yAxis 为数组,并且在 series 对象中,设置 yAxisIndex 为 yAxis 对应的索引。
-
线,点,区域的设置,比如颜色,粗细等
// 线的颜色 lineStyle: { color: "#38BA3B", width: 1, }, // 点的颜色 itemStyle: { color: "#38BA3B", }, // 区域的颜色 areaStyle: { color: { type: "linear", x: 0, y: 0, x2: 0, y2: 1, colorStops: [ { offset: 0, color: "#38BA3B", // 0% 处的颜色 }, { offset: 1, color: "#ffffff", // 100% 处的颜色 }, ], }, }, -
echarts 自适应处理。当窗口大小改变时,echarts 也能随着改变。(nuxt echarts 自适应)
<template>
    <client-only>
        <v-chart class="chart mt-5" ref="chartRef" :option="option" />
    </client-only>
…
</template>

<script setup lang="ts">
…
import VChart, { THEME_KEY } from 'vue-echarts';
const chartRef = ref<InstanceType<typeof VChart> | null>(null)

onMounted(() => {
    window.addEventListener('resize', resizeHandler)
})

onUnmounted(() => {
    window.removeEventListener('resize', resizeHandler)
})

function resizeHandler() {
    chartRef.value?.resize()
}